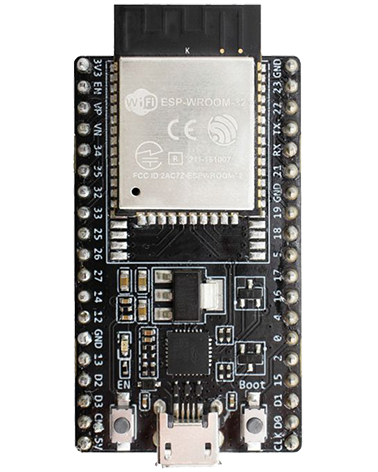
ESP-Prog programmer / debugger
For details on installing see here.
Installing debugger
VS Code has a built-in debugger, its setup documentation is here. Apparently some people use it successfully for Espressif chips (launch.json “type”: “gdb”).
Espressif have a dedicated VS Code extension for debugging which is likely the better choice (launch.json “type”: “espidf”) and that’s what we use here.
Espressif docs:
vscode-esp-idf-extension – Basic use of the extension
vscode-esp-idf-extension – Configuration for Visual Studio Code Debug
vscode-esp-idf-extension – Debugging
Configuring before you start debugging
Do you need to check your project configuration?
Menu > View > Command Palette > Type: “ESP-IDF: SDK Configuration editor” (or use CTRL+E then G)
Wait for it to load
Setup
The VSCode bottom blue toolbar has all the ESP-IDF setup, build and debugging options on it, starting from the left end (ignore the default VSCode ‘Build’ etc buttons towards the right end of it).
Work from the left end in checking each of the button options selected is correct / pressing and making sure you select the relevant options for what you are doing.
Compiling
Clean
Bin icon in bottom blue toolbar.
Build
Spanner icon in bottom blue toolbar, or CTRL+E then B
Or Menu > Terminal > Run Build Task
Serial port programming and monitor (e.g. using ESP-Prog)
Select the “UART” option for “ESP-IDF Select flash method” button in the bottom blue toolbar
Select the correct COM port for the “ESP-IDF Select port to use” button.
Press the “ESP-IDF Flash device” or the “ESP-IDF Build, Flash and monitor” button.
To exit from IDF monitor use “Ctrl+]”
JTAG port programming and monitor (e.g. using ESP-Prog)
ESP32 device configuration for JTAG debugging
Some ESP32 devices (e.g. ESP32 S3, ESP32 C3) have an eFuse that needs to be burnt using the serial port to enable using the JTAG pins, instead of JTAG programming via the USB interface – see here.
Visual Studio Code configuration for debugging
.vscode/launch.json
The config in this file sets up your debug adapter and what is run when you debug (see https://github.com/espressif/vscode-esp-idf-extension/blob/master/docs/DEBUGGING.md )
Example config:
{
	"version": "0.2.0",
	"configurations": [
	  {
		"name": "OpenOCD Debugging",
		"type": "espidf",
		"request": "launch",
		"debugPort": 9998,
		"logLevel": 2,
		"mode": "manual",
		"verifyAppBinBeforeDebug": false,
		"tmoScaleFactor": 1,
		"initGdbCommands": [
		  "target remote :3333",
		  "symbol-file ./build/MY_OUTPUT_FILE_NAME.elf",
		  "mon reset halt",
		  "flushregs",
		  "thb app_main",
		  "c"
		],
		"env": {
		  "CUSTOM_ENV_VAR": "SOME_VALUE"
		}
	  }
	]
}
OpenOCD Server
Select the “JTAG” option for “ESP-IDF Select flash method” button in the bottom blue toolbar.
You start and stop OpenOCD Server it using the “[OpenOCD Server]” button on the bottom blue toolbar.
(If you can’t start OpenOCD Server ensure the JTAG driver is installed / active for your ESP-Prog – see here).
Program
Press the lightning button in the bottom blue toolbar, called “ESP-IDF Flash Device”
(To see the programming status, switch to the OUTPUT window, turn on auto scrolling (padlock button).
Start debugging
Press: F5
Debugging issues
See here.
Debugging tools
Full log output via the serial port using esp-idf debug
Docs
Debugger settings
.vscode/settings.json > idf.openOCDConfigs

